This is an instructional demonstration tool, designed to show you how to use the Interactive Data Reports and Benchmark Reports that accompany the GMAC mba.com Prospective Students, Application Trends, Corporate Recruiters, and Alumni Perspectives Surveys. The results presented here are for demonstration purposes only, and do not represent actual survey results.
|
One of the many benefits of participating in GMAC surveys is access to Interactive Data Reports and Benchmark Reports. These easy-to-use online reports are available only to participating schools and survey respondents.
What is the Interactive Data Report? Each Interactive Data Report provides overall survey results, as well as findings by key demographic variables such as age, gender, program type, world region, industry, class year, etc. The graphic image to the right is a screen shot taken from the 2015 Corporate Recruiters Survey Data Report. It was configured to show 2015 employer hiring projections overall for all respondents (blue columns) compared with hiring projections for employers located in the Asia-Pacific region (yellow columns).
What is the Benchmark Report? The Benchmark Report compares the responses associated with your program with the responses (in aggregate) of 5 or more participating programs of your choice. The Benchmark Report tool allows you to create a maximum of five separate benchmark reports, but once created, they can be saved and will be available to you indefinitely, each time you access them.
Use these queries to compare survey responses from your program with those of your direct competitors, programs you hope to compete with, or those in a particular region. The choices are yours! | 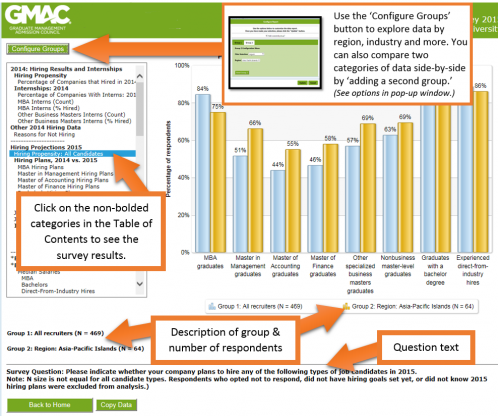 |
|
How can I use the comparison data from these reports? Programs use the data in so many ways!- Download the figures and use them in a presentation to your dean.
- Download the data and create your own graphics or use them to write a report.
- Explore survey-specific findings in greater depth!
- Improve your marketing campaign by exploring the motives, reservations and psychographic profiles of prospective students (mba.com Prospective Students Survey Note: Interactive Data Report Only).
- What is happening to student demand for part-time MBA programs? (Application Trends Survey)
- In which industries and job functions are employers placing new graduate business hires this year? (Corporate Recruiters Survey)
- What do alumni have to say about their post-degree salary, employment status, current job level, and job satisfaction? (Alumni Perspectives Survey)
|